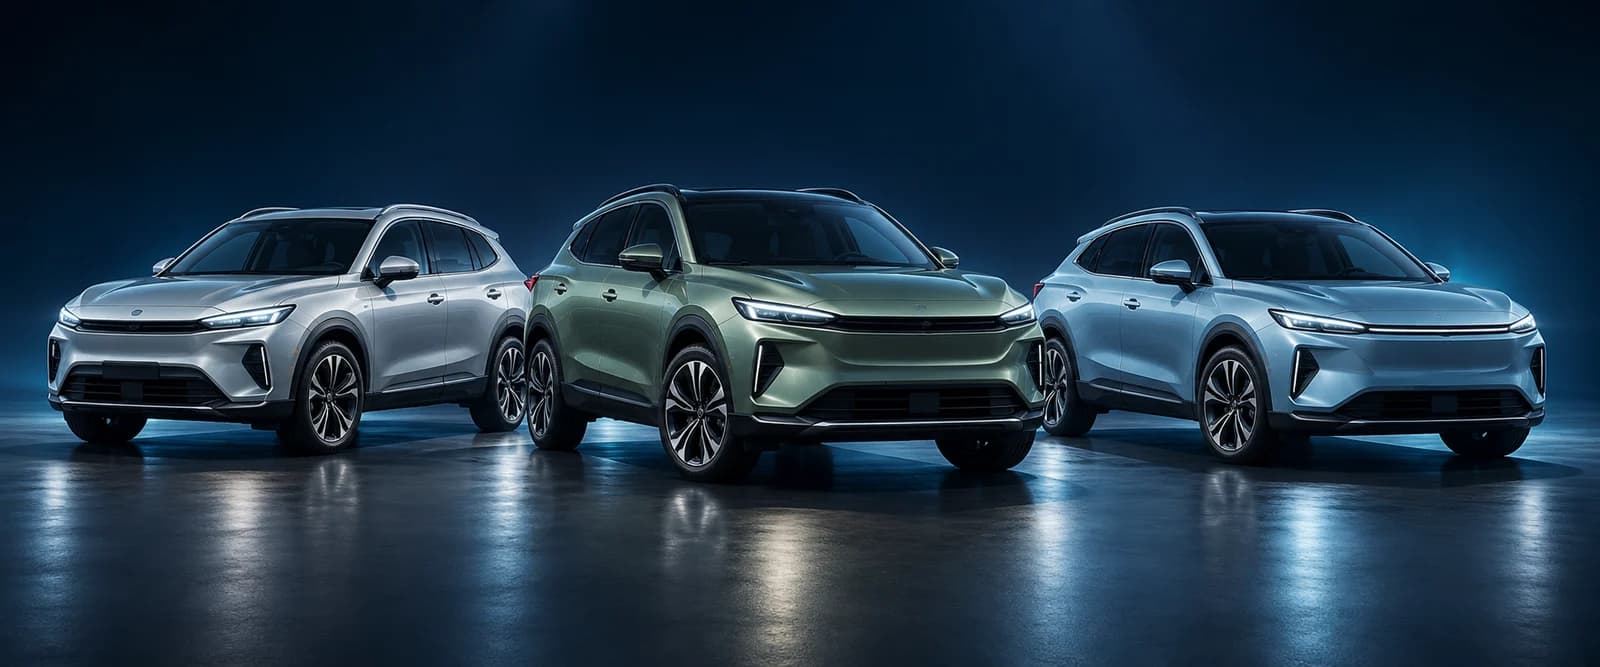
AI-generated illustration · not model specifications or quotations
Consumer Cost Workspace · Free
Explain ownership economics
Compare petrol, CNG and electric configurations on the same distance and holding period.
 AUTIQA
India / Passenger vehicles / Business intelligence
Understand a market. Compare ownership economics. Plan a fleet. Get usable outputs—and the evidence to explain them.
For analysts, OEM teams, dealers, fleet operators and software builders.
Maharashtra
5 years · 15,000 km/yr
Petrol
Ex-showroom
₹12.00L
Cost / km*
₹22.90
CNG
Ex-showroom
₹13.00L
Cost / km*
₹20.89
Electric
Ex-showroom
₹16.00L
Cost / km*
₹21.49
Upfront price ≠ lifetime cost
₹ LAKH| Configuration | Gross cost | After resale* |
|---|---|---|
| Petrol | 23,24,622 | 17,17,421.713 |
| CNG | 21,86,775 | 15,66,935.283 |
| Electric | 23,12,616 | 16,11,976 |
20% down payment, 8.5% finance over 60 months. Fixed example energy rates. Engine autiqa-tco-engine-2026.08.v2. Vehicle prices and efficiencies differ; all inputs are editable in the example.
Working tools · No purchase required
Explore a worked ownership or fleet scenario. Inspect its real output chart, change the assumptions and export a result. Scenarios save in this browser.
AI-generated illustration · not model specifications or quotations
Consumer Cost Workspace · Free
Compare petrol, CNG and electric configurations on the same distance and holding period.
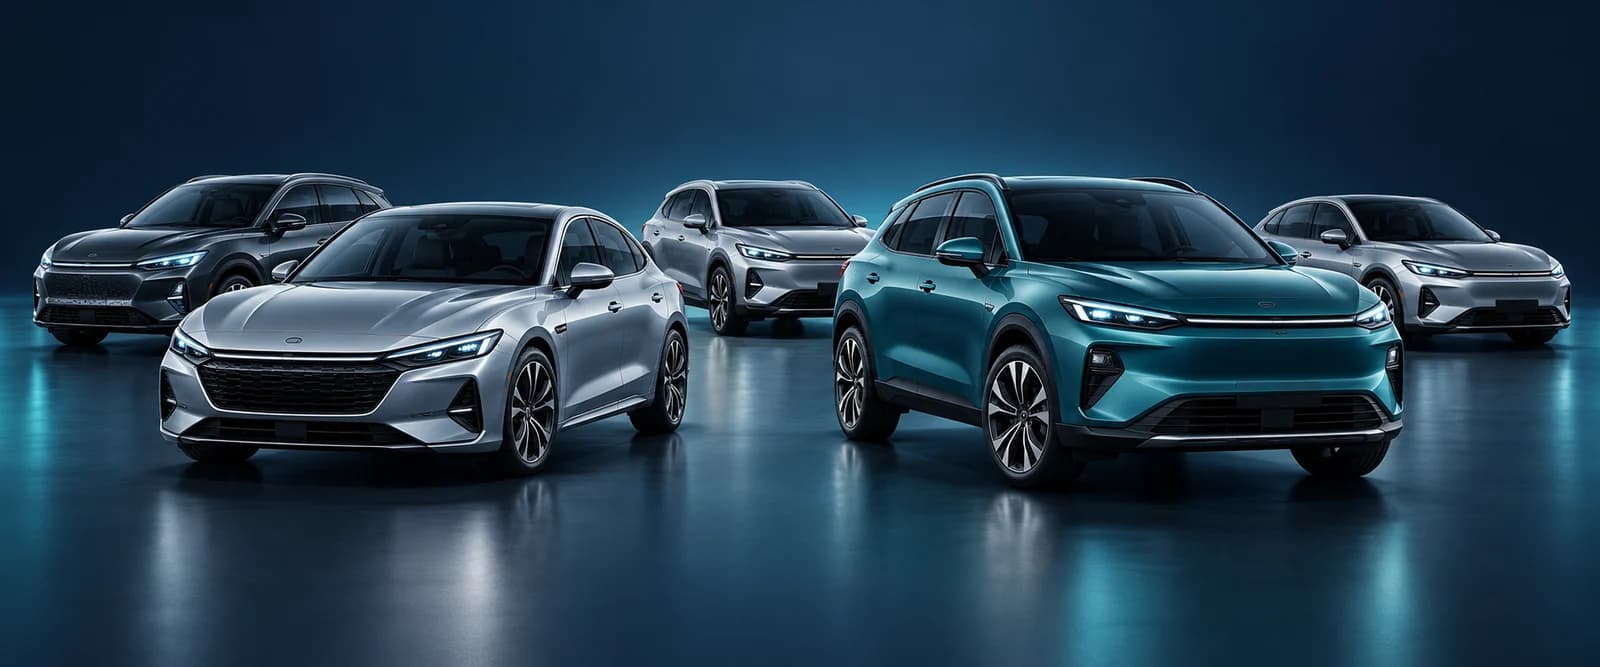
AI-generated illustration · not model specifications or quotations
Fleet Workspace · Free
Keep vehicle quantities, utilisation, energy costs and annual cash flow visible.
Autiqa Lens · Free registration analytics
Move from a national trend to manufacturer share, state differences and fuel mix. These charts use the same passenger-vehicle release as Lens—not invented dashboard data.
Public dashboard: no sign-in.
Historical explorer: free Google account.
Autiqa Lens / India
4,24,624
Sep 2026 · Published period
Fuel mix
Sep 2026
| Period | Registrations |
|---|---|
| 2025-10 | 5,86,791 |
| 2025-11 | 4,22,024 |
| 2025-12 | 3,97,139 |
| 2026-01 | 5,40,566 |
| 2026-02 | 4,12,201 |
| 2026-03 | 4,65,003 |
| 2026-04 | 4,24,957 |
| 2026-05 | 4,11,729 |
| 2026-06 | 4,19,307 |
| 2026-07 | 4,16,647 |
| 2026-08 | 4,04,914 |
| 2026-09 | 4,24,624 |
Auto IQ
Analysis, white papers and practical guides for automotive businesses. Understand the evidence, then put it to work.
Treat regional markets as different combinations of infrastructure, demand and fuel adoption before extrapolating a national headline.
For Analysts · OEM strategy · Dealers
· Coverage: Research note
The Map Is the Market
Read the analysis →Use the same distance, holding period and finance basis; inspect gross cost, resale-adjusted cost and sensitivity before presenting a comparison.
For Dealers · OEM commercial teams · Advisers
Compare ownership costs for a sales or advisory workflow
Read the practical guide →Use bounded evidence, contributions, dependencies and alternative paths to make a market review more useful for a decision.
For Strategy · Analysts · OEM teams
· Coverage: Research note
Beyond the Point Forecast
Read the white paper →Defined deliverables
Choose a specific approved release, or read existing reports with their actual reporting periods, versions and sources.
Data · Automotive data
AvailableAnalyse an approved registration release without rebuilding the data pipeline.
You receive: Release-specific Excel, SQLite, source evidence, mappings, manifest and licence as listed on the package.
Report · Market research
FreeUnderstand what the market evidence means before commissioning or buying deeper work.
You receive: Existing web research, figures, methodology and available PDFs. Public reports remain free.
Your task comes first
Analysts · OEMs · Dealers
Compare scale, fuel mix and OEM presence; then inspect the relevant report or release.
Explore state evidence →Dealers · OEM commercial teams
Compare configurations with the same distance, period and explicit financing basis.
Open the cost example →Fleet operators · Advisers
Inspect vehicle types, quantities, utilisation, energy costs and cash flow.
Open the fleet example →Strategy · Analysts · Dealers
Start with an actual reporting period, sources and a substantial analysis.
Read existing reports →Software builders · Digital teams
Understand the output in the working tool, then inspect the integration contract.
Review integration examples →Integration
Inspect working outputs, then review sample contracts for registration aggregates, ownership and fleet costs. Production API access is not yet on sale.
Explore developer examples →Custom requirement
Tell us the business decision, geography, period and required format. We will confirm available evidence and the smallest useful scope.
Discuss your requirement →About Autiqa
Autiqa connects Indian passenger-vehicle registration evidence, transparent ownership calculations and practical research for automotive businesses. We make coverage and assumptions visible so the output can be questioned, reproduced and used.
Founded by Kapil Gupta and built from Hyderabad. Auto IQ is our research and education layer; Lens and the cost workspaces let you apply the thinking.
Meet Autiqa →Auto IQ by email
Optional automotive business analysis and practical guides. Newsletter consent is separate from using a tool or buying data.
Free. Unsubscribe anytime. Delivered by Beehiiv.